Investment Performance – January 2014
Below you will find the investment performance data for January 2014.

- This report is for the time period of 1 July 14 to 31 December 14
- On 17 Dec 2014 there was a dis-investment on the account of 47,143.13 units (£50,000)
- The total value of the investments held across the 2 accounts at 31 December 14 is £532,268.08, compared to £571,706.65 at 30 September 14
- The HC Sequel Cautious Target Return Fund had assets under management of £48,886,662 at 31 December 14
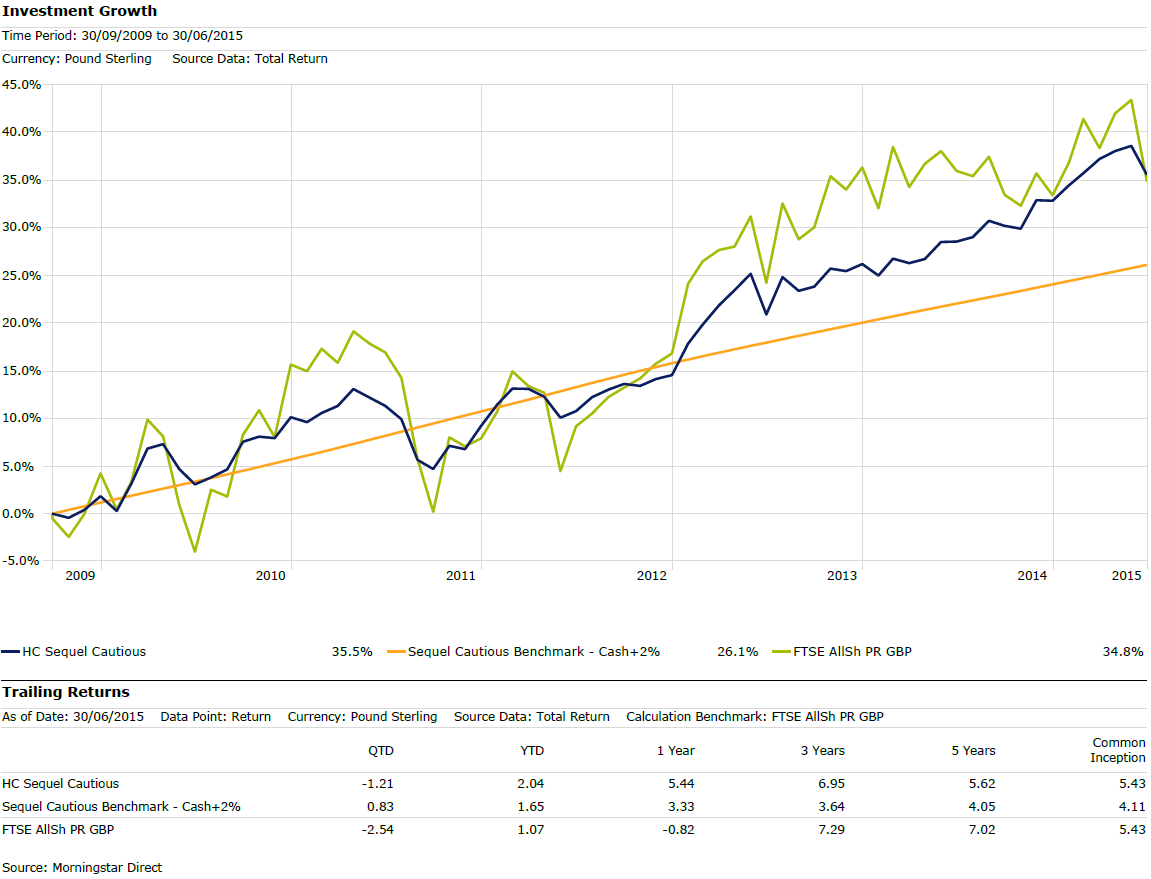
The investment manager benchmark for the cautious Fund is cash +2% (over the return that could be expected from long term cash deposits) per annum.
• The third quarter of 2014 for the Cautious Fund saw a return of +2.02%. When compared to the benchmark return of 0.83% over the quarter, this represents an outperformance to the benchmark of 1.19%.- The Total Expense Ratio (TER) of a fund is defined as the ratio of its total operating costs to its average net asset value (the total expected price of investing). The TER as at 31 December 14 was 1.90%
- The Portfolio Turnover Ratio (PTR) is the cost to help investors estimate the likely size of transaction costs. The PTR for the Q4 14 was -9.59%. Investor cash flows were greater than portfolio transactions over the quarter as the Fund Manager took a more cautious view.
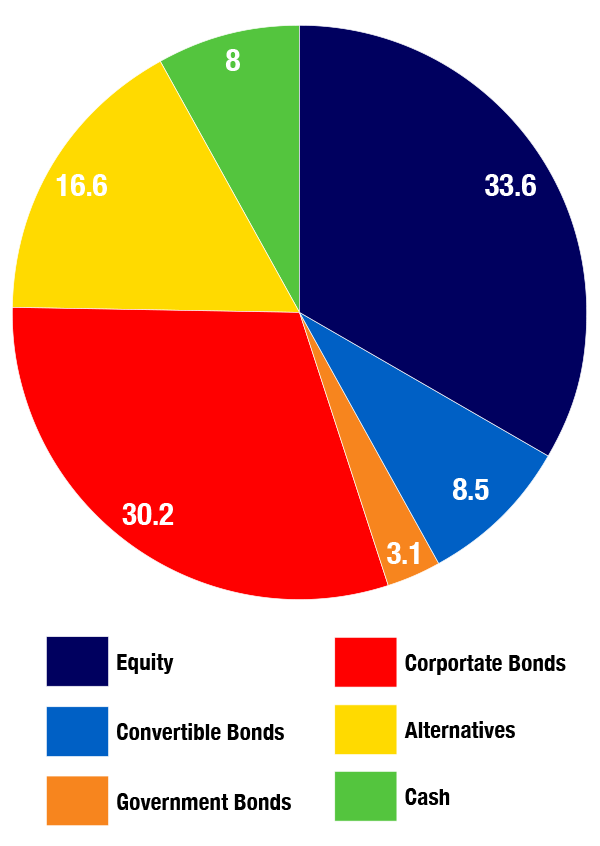
Current Asset Allocation (%)

Fund Commentary – Quarter: 1 July 14 to 31 December 14
Market Commentary
Striking divergence remains in the pace of global recovery, with the US and UK economies both up versus 2008, while Japan is back in recession and the potential for full blown quantitative easing (QE) is growing in Europe. In China, cuts to lending and deposit rates have marked the start of an easing cycle against a backdrop of reform. A significant drop in the oil price is benefiting consumers in oil importing nations, though also heightening concerns of default for oil exporters.
Fund Commentary
During the quarter we established a new position in Bluefield Solar Income, which holds a portfolio of solar farms across the UK and aims to provide a 6 to 7% yield per annum. Other portfolio activity included adding to our existing positions in Jupiter Global Convertibles and Maple-Brown Abbott.
US equities continued to be the standout performers, with Vulcan Value Equity and SPDR S&P500 topping the contributors for a second straight quarter. Other top performers included Jupiter Global Convertibles and the iShares GBP Corportate Bond ETD, the latter benefitting from yet further compression fo UK gilt yields. The main detractor for the quarter was NB Distressed Debt, which declined mainly due to its discount to NAV widening.

